

Case Studies: Strategy in Action
At Chapel Hill Advisors, we don't just design pricing and growth strategies — we help bring them to life. Below are real examples of the impact we’ve delivered across industries, from post-merger integration to global trade disruptions. Each case reflects our hands-on approach, analytical rigor, and commitment to lasting change.
These aren’t theoretical frameworks — they are road-tested playbooks.
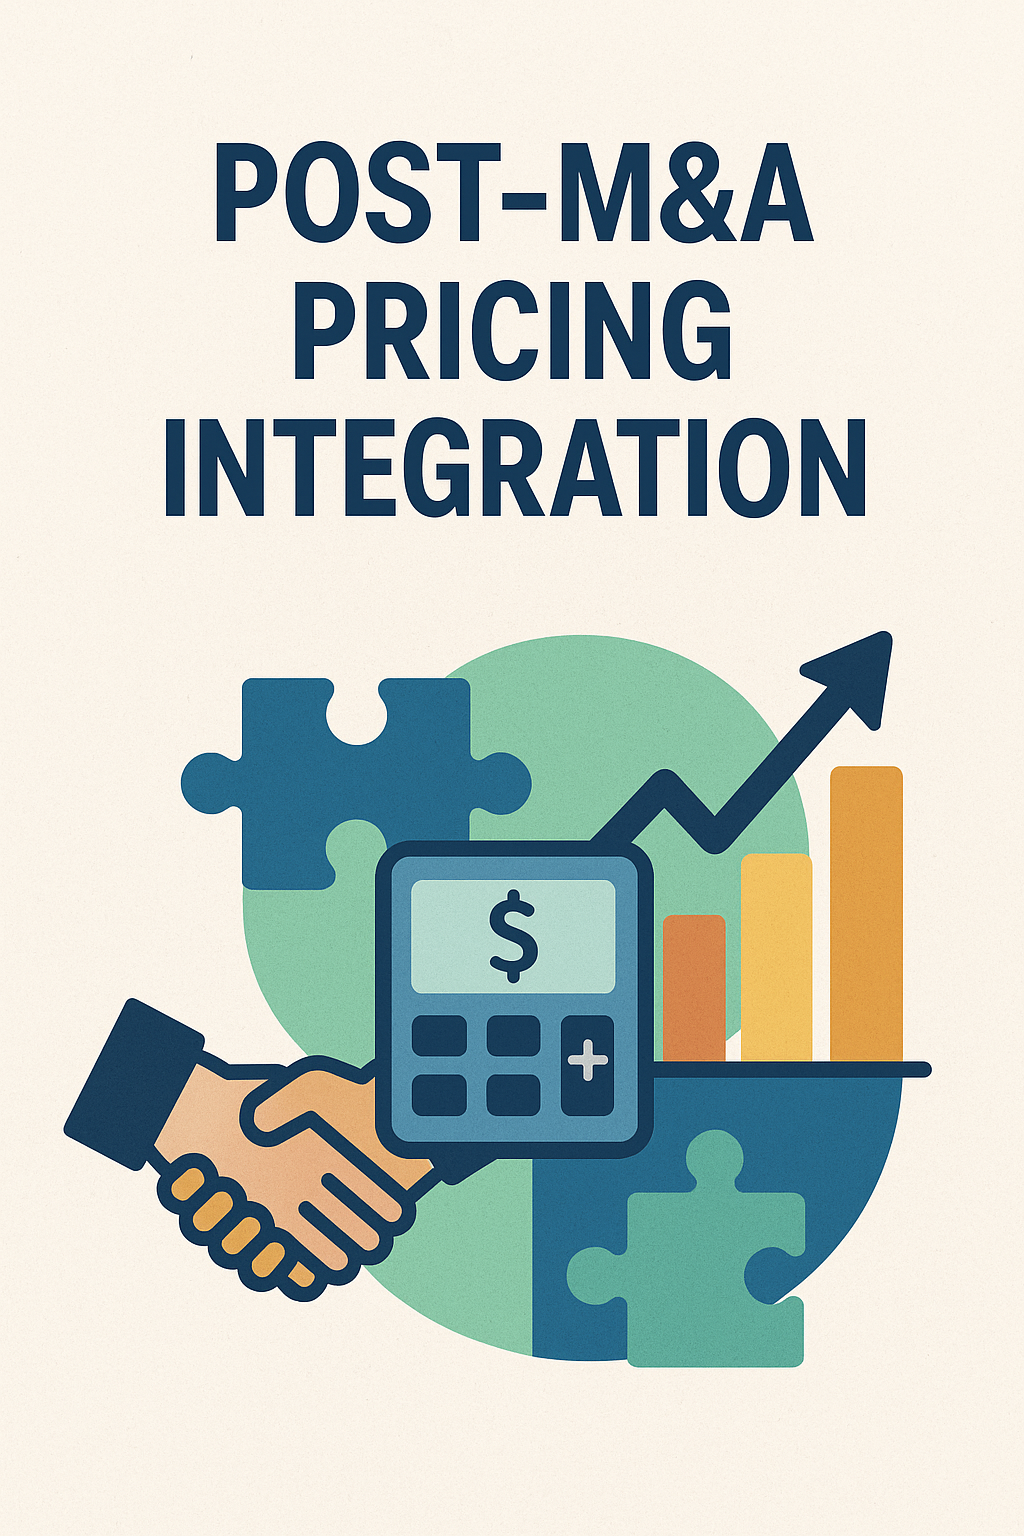
Post M&A Pricing Integration
Background
A Fortune 500 corporation in the midst of integrating two major business units after a strategic merger.
Challenge
The merger exposed a $50 million pricing risk, stemming from inconsistent pricing policies, overlapping accounts, and uncoordinated customer negotiations.
Approach
We created a cross-functional pricing command center chaired by the two CFOs and the Chief Sales Officer of the newly formed entity. Key actions included:
· Establishing rules of engagement for the combined sales force
· Designing customer-specific negotiation strategies and tactics
· Encouraging healthy internal competition to reach pricing targets
· Defining escalation protocols and Go/No-Go gates for deal approval
· Guiding execution through regular steering committee cadences
· Capturing lessons learned to refine the approach over time
Results
The team successfully neutralized the entire $50 million risk without customer attrition or margin erosion.
Longer-term, the pricing governance and execution framework now sets a higher bar for future customer negotiations, reducing risk of post-merger price degradation.
Ideal Stakeholders
CEO, CFO, Chief Sales/Marketing Officer, Chief Commercial Officer
Impact Timeline
· 3-12 months: Tangible P&L impact based on new deal terms
· Long-term: Strengthened pricing discipline and customer expectations

Pricing Strategy for Tariff and Cost Recovery
How a mid-sized manufacturer offset a 70% raw material cost spike without losing share
Background
A mid-sized, unprofitable business was hit with a cost tsunami when one of its core raw materials — a key chemical comprising 30% of input costs — spiked 70% due to a sudden global supply shock.
Challenge
With margin pressure mounting and pricing misaligned with true input costs, the company needed to navigate urgent cost recovery without losing customers or damaging its brand.
Approach
We built a rapid-response pricing strategy that included both structural analysis and field execution:
Evaluated options for cost mitigation, including alternative materials and supply chain shifts
Calculated required price increases to restore gross margins
Analyzed market, channel, and competitor dynamics to guide pass-through decisions
Conducted primary market research to gauge customer price elasticity
Built a negotiation strategy tailored to each major account
Rolled out a structured communication plan, including detailed FAQs for customers, distributors, and frontline staff
Supported execution through price negotiations over several months
Results
Offset the entire inflation impact, protecting margin while retaining market share
Developed a repeatable playbook and trained the organization to respond faster next time
Ideal Stakeholders
CEO, CFO, Chief Sales/Marketing Officer, Chief Commercial Officer
Impact Timeline
3–9 months: Tangible P&L impact from new pricing and deal terms
Long-term: Strengthened pricing discipline and reset customer expectations
Price Waterfall for Margin Recovery
Background
A consumer-packaged goods company was struggling with deteriorating margins across its product portfolio. Discounts and deductions had become layered and inconsistent, making it difficult for leadership to pinpoint where profits were leaking.
Challenge
The company lacked clear visibility into how much of the list price actually made it to the bottom line. Pricing terms varied widely across customers, and operational decisions — like freight handling and returns — were eroding profitability in hidden ways.
Approach
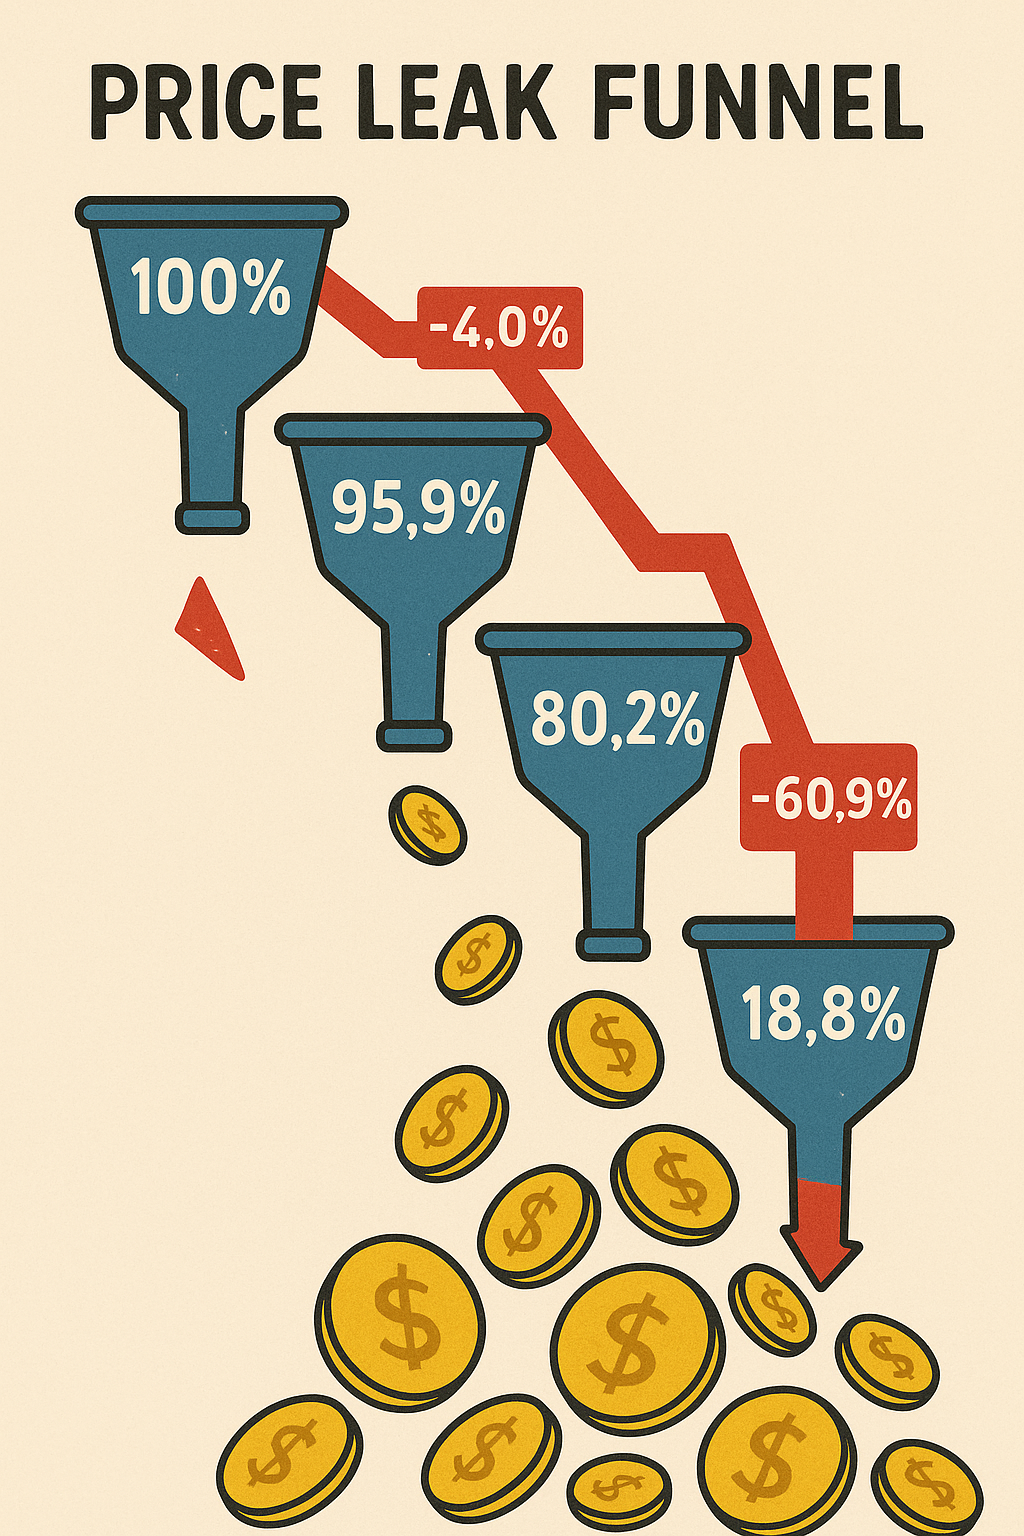
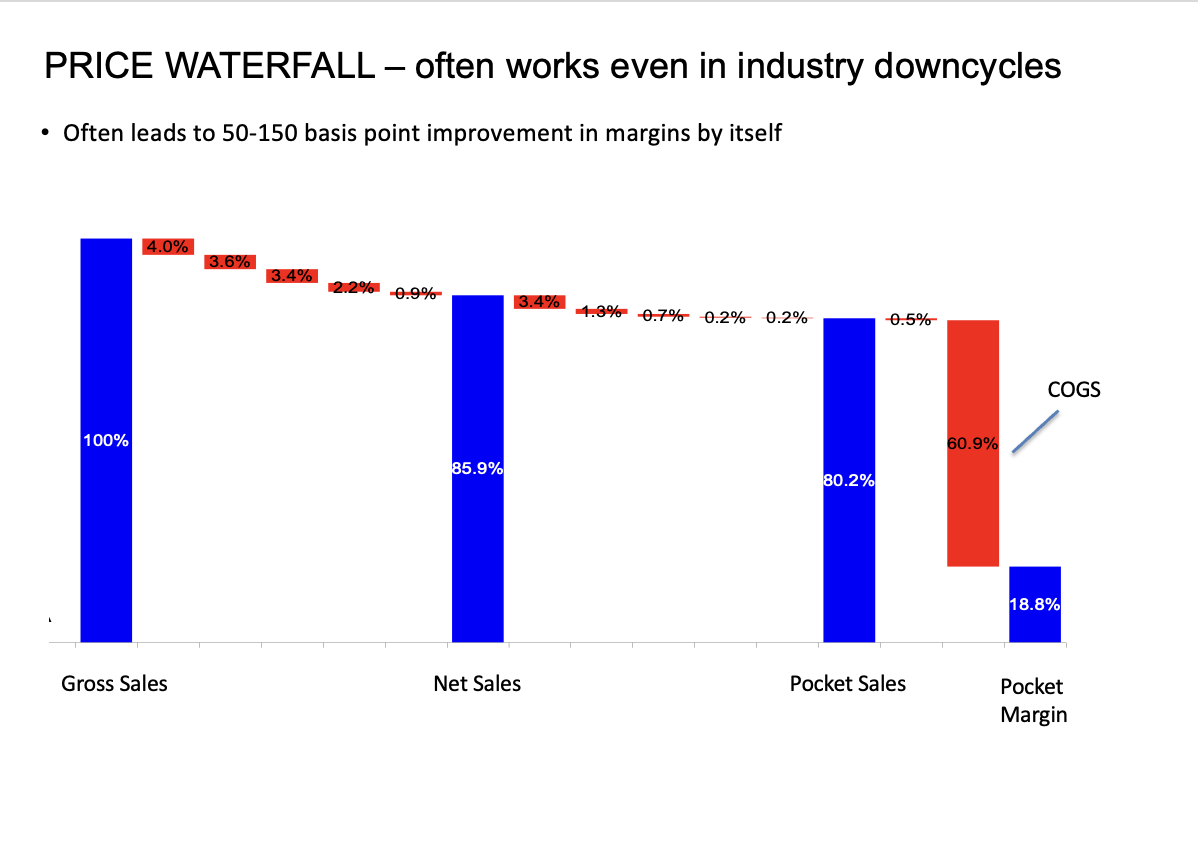
We introduced a price waterfall framework to create transparency across every step of the pricing and revenue realization process. Our work included:
Mapping the full sequence from List Price to Contribution Margin
Quantifying the impact of discounts, returns, trade spend, shipping terms, commissions, volume rebates, etc.
Identifying common areas of margin leakage and policy inconsistency
Benchmarking against internal and external best practices
Facilitating workshops with Sales, Finance, and Customer Operations to validate drivers and identify actionable levers
To support execution, we built an internal dashboard prototype and trained teams to use the waterfall as an ongoing decision tool.
Results
Identified and quantified over $8 million in margin leakage
Created a cross-functional roadmap of quick wins and structural changes
Enabled Sales and Finance to have a shared view of true deal profitability
Delivered a repeatable template for price waterfall analysis across other business units
Ideal Stakeholders
Head of Sales, CFO, VP of Commercial Finance, Chief Operating Officer
Impact Timeline
1–3 months: Visibility into margin erosion and quick-win opportunities
6–12 months: Sustainable improvements in pricing discipline and deal quality

AI-enabled Pricing
Background
A global semiconductor manufacturer was struggling with inconsistent pricing and unreliable revenue forecasts across distribution channels and market segments. This led to chronic over-discounting and inflated revenue projections, contributing to margin erosion.
Challenge
The pricing team lacked visibility into segment-level dynamics and historical win-rate data. Without automated checks or approvals, quotes with excessive discounts were routinely submitted and accepted — undermining pricing effectiveness and revenue forecasts.
Approach
We deployed an AI-driven pricing model that:
Recommended price bands for each segment based on optimized revenue potential
Predicted expected volumes by segment using historical deal behavior
Delivered real-time pricing guidance via an API integrated with the quoting tool
Retrained dynamically as new data flowed in to improve performance over time
Results
Reduced out-of-band quotes by 90% while maintaining win rates
Increased realized revenue by 10%
Significantly improved forecast accuracy
Required managerial review for deviations, strengthening pricing discipline
Ideal Stakeholders
CEO, Head of Sales, Chief Commercial Officer, CFO
Impact Timeline
1–3 Months: Segmentation insights, pricing behavior visibility, model recommendations
3–9 Months: Full system integration, analytics stabilization, real-time quote enablement

Competitive Strategy Development
Client Context
A $600M outsourced services provider (let’s call them “ACME”) was facing steady market share and pricing erosion. While their internal metrics showed labor productivity gains, customers perceived it as reduced service — especially as a smaller, aggressive competitor moved in on their best accounts.
Challenge
The competitor was:
Targeting ACME’s highest-margin customer segments
Leveraging buyer turnover to reframe ACME’s value proposition
Capitalizing on confusion created by operational improvements that weren’t positioned as customer wins
ACME was losing share and price without fully understanding why.
Solution
We conducted:
Customer interviews across key accounts
Internal interviews with sales and marketing leaders
A focused win/loss analysis of deals from the prior 18 months
From this, we delivered a focused 3-month action plan to:
Stabilize vulnerable accounts
Reassert value in target segments
Equip field teams to reframe the narrative on service and productivity
Result
The client gained clarity on why share loss was accelerating and what to do about it. The leadership team moved forward enthusiastically with execution — and began taking back ground in priority segments.Ideal Stakeholders
CEO, Chief Sales/Marketing Officer, Chief Commercial Officer, CFO
Impact Timeline
· 3-9 months: Tangible Revenue / P&L impact
· Long-term: Strengthened competitive position

Growth Strategy Process
Background
A multi-billion dollar industrial manufacturer set aggressive growth targets over a 3-year horizon. However, existing sales forecasts fell short of the goal, and the product innovation and M&A pipelines lacked sufficient volume to close the gap.
Challenge
The business faced a critical shortfall in its forward-looking growth pipeline. There was no structured ideation or vetting process in place to identify, prioritize, and pursue new opportunities, making the path to target unclear and under-resourced.
Approach
We created and operationalized a structured innovation pipeline to systematically generate, evaluate, and fund new growth ideas. Key actions included:
· Designing a repeatable ideation process tied to business strategy
· Vetting ideas through venture-style tollgates
· Prioritizing ideas based on impact, feasibility, and alignment
· Driving the first wave through the system to fine-tune the model
· Equipping leadership with a clear playbook for ongoing growth activation
Results
The engagement yielded a high-quality portfolio of growth initiatives, each vetted and prioritized for investment or acceleration. The process enabled leadership to close the forecast gap and set a foundation for ongoing growth execution. Seven new growth initiatives were prioritized. This process also encouraged a culture of proactive growth ownership across BU leadership. Ideas included service expansion, new product opportunities, geographic expansion, and new inorganic growth in adjacent white spaces. Longer-term, the organization now has a repeatable capability for structured innovation and growth.
Ideal Stakeholders
CEO, Chief Commercial Officer, CFO
Impact Timeline
· 6–12 months: Initial growth pipeline activation and gap closure
· Long-term: Embedded capability for strategic growth planning and execution